Bitcoin Drops Below $100K — Fear Index Hits 14 as Liquidity Clusters Form
📉 Bitcoin’s Most Awkward Correlation Yet — But Under the Surface, Strength Is Building
BTC is dropping harder with stocks and rising weaker — a frustrating macro tether that usually appears at market bottoms, not tops.
Bitcoin is wrestling with one of the most uncomfortable correlation regimes in modern macro — moving in sync with equities on the way down but refusing to follow them higher. And yet, despite this distorted relationship and intense sell-side pressure, BTC continues to show structural resilience. In moments when markets typically break, Bitcoin is signaling something else: underlying strength.
🔎 Quick Facts
- 📉 BTC is ~25% below ATH but still trading like it’s in a bottom-phase structure.
- 📊 Nasdaq correlation: BTC falls harder on dips, rises softer on pumps.
- 😨 Fear & Greed Index: 14/100 — same zone as Feb 2025 and June 2022.
- 💥 Liquidation cluster: $80K–$90K packed with overleveraged longs.
- 📈 CME true gap unfilled: $92K–$92.5K likely to attract price.
- ⚠️ BTC below weekly Supertrend & EMA50 — correction still active.
📉 BTC’s “Most Frustrating Correlation Environment in Years”
Crypto analysts describe the current environment as uniquely painful: Bitcoin moves with equities, but asymmetrically:
- ⬇️ Drops harder when Nasdaq falls.
- ⬆️ Pumps softer when Nasdaq recovers.
Wintermute calls this a hallmark of macro-bottom behavior, not cycle-top exhaustion. This pattern historically emerges when:
- forced sellers dominate,
- positioning is stretched,
- sentiment is exhausted.
And yet — BTC already printed multiple ATHs this year and still holds a structurally bullish long-term pattern.
😨 Fear Index at 14/100 — Matching Two Key Inflection Points
MNFund and MNCapital CIO CryptoMichNL highlights the current Fear & Greed Index: 14/100. This level appeared only twice in recent memory:
- 📉 Feb 2025 — before a -20% monthly drawdown
- 🔥 June 2022 — the Luna collapse capitulation bottom
Both moments marked short-lived pain → major mid-term reversals.
“It feels brutal when BTC and the broader crypto market crash together, but these phases never last long. Patience remains the most profitable strategy.” — CryptoMichNL
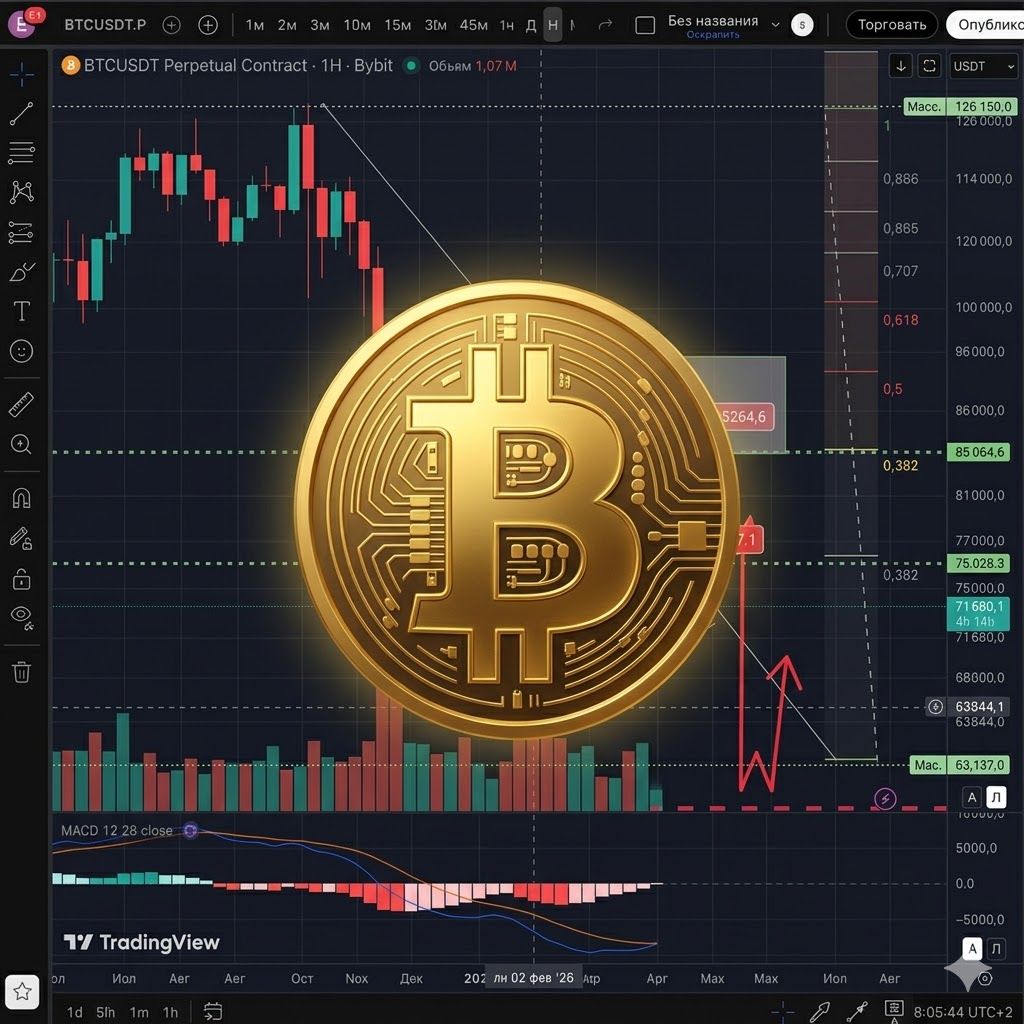
🌊 Liquidity Mapping: BTC Enters Two Massive Zones
According to Stockmoney Lizards, Bitcoin is now inside two decisive liquidity pockets:
1. $80K–$90K long-liquidation cluster
This is where overleveraged longs get flushed. When liquidity is dense, market makers often guide price directly into the zone. BTC is sitting right inside it.
2. CME true gap at $92K–$92.5K
This gap has no wick — meaning the market never tested it. Historically, these gaps get filled.
But there’s still a problem: momentum signals confirm the correction phase is intact. BTC broke below:
- 📉 weekly Supertrend,
- 📉 weekly EMA50.
Short-term pressure remains bearish — even if a bounce is likely.
🔭 What Comes Next?
📌 The Bounce Scenario
$90K is the natural reaction zone. If BTC holds it, price could:
- move up to fill the $92K CME gap,
- attempt a rebound into higher ranges.
📌 The Deeper Slide Scenario
If $90K fails, BTC may revisit the mid-$80K region where liquidity and forced-liquidation pockets intensify.
🧭 The Bigger Picture
Despite volatility, extreme fear, and uncomfortable correlations, Bitcoin still behaves like it’s forming a late-cycle higher low, not breaking down. This is historically when long-term buyers step in.
If equities stabilize or liquidity rotates back into risk assets, BTC may reclaim the CME gap and retest higher levels. Until then, the strategy remains the same: Patience.
✅ TL;DR
- BTC is stuck in asymmetric correlation with equities — classic bottom behavior.
- Fear Index at 14/100 matches past reversal zones.
- Two massive liquidity zones: $80K–$90K and $92K CME gap.
- Correction still active — BTC under weekly Supertrend and EMA50.
- Market likely sees a bounce before any deeper slide.
📚 Read Also

Recent News


All Time High • Live
Have questions or want to collaborate? Reach us at: [email protected]