Bitcoin at $76k: Institutional Pump or a Liquidity Trap?
Bitcoin (BTC): Institutional Demand Surges, but a Market Trap May Be Looming
The Institutional Engine: ETF Inflows Accelerate 🏦
Institutional demand is currently the primary catalyst for the current price action. U.S. Spot Bitcoin ETFs have demonstrated remarkable consistency:
- 6 consecutive days of net inflows.
- Total accumulation of approximately $1 billion.
- Dominant leadership from BlackRock and Fidelity Investments.
The Bottom Line: Bitcoin is rapidly solidifying its status as "Digital Gold," a geopolitical hedge, and a cornerstone institutional asset. Constant buying through ETFs provides a "floor" for the price.
Exchange Behavior: Accumulation Phase Re-Engaged 📈
Following a period of selling pressure in February, exchange data suggests a shift back to accumulation:
- Binance Volume Delta: +$21 million
- Coinbase Volume Delta: +$14 million
This reversal indicates that the market has moved from distribution back to accumulation. We are seeing increased participation from both retail investors and "whales."
Technical Outlook: The Liquidity Squeeze 📊
Bitcoin is navigating a high-stakes "decision zone." The chart reveals a clear upward structure attempting to break out of a long-term downtrend.
- Resistance Zone: $77,400 – $84,500
- Critical Breakout Confirmation: $83,000 – $84,000
- Primary Support: $60,000
- Global Liquidity Zone: $48,000
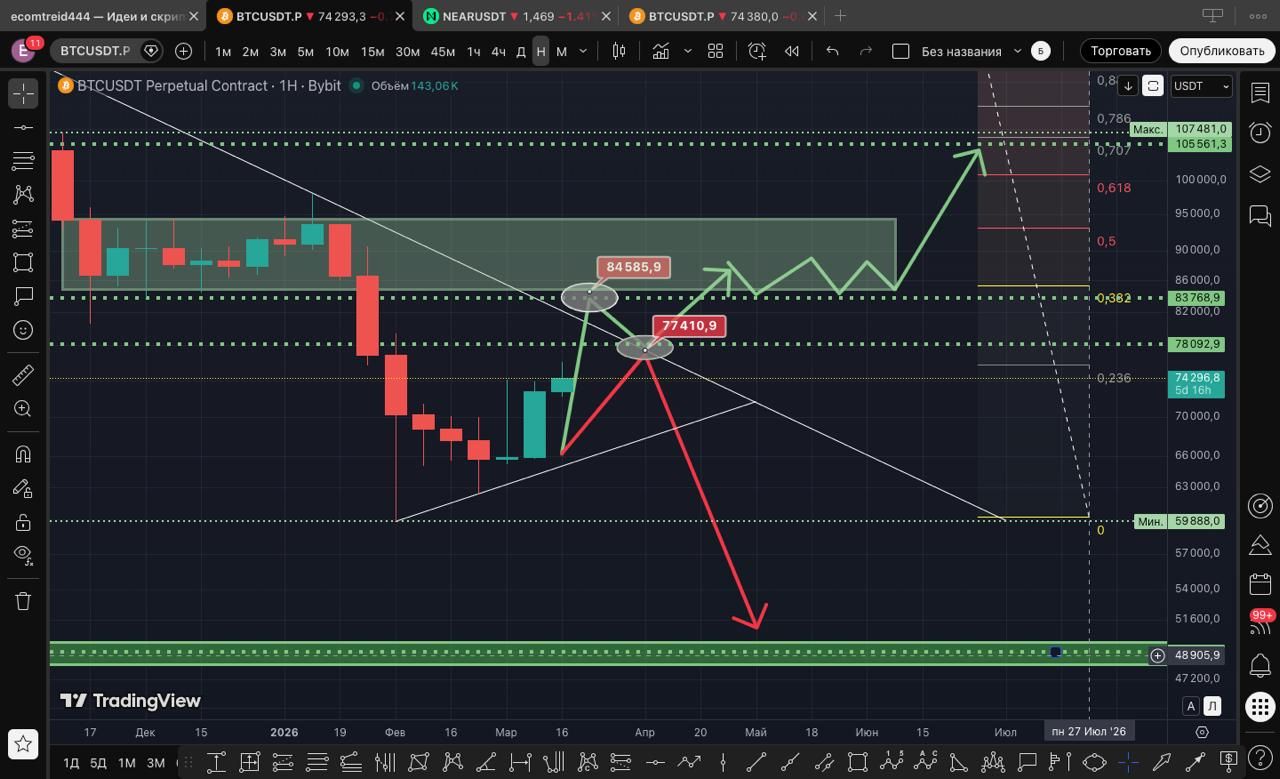
Two Critical Market Scenarios ⚠️
🟢The Bullish Path If the weekly candle closes above $83,000–$84,000, the market confirms a trend expansion toward $90,000 – $100,000. Institutional demand has completely overwhelmed speculative selling.
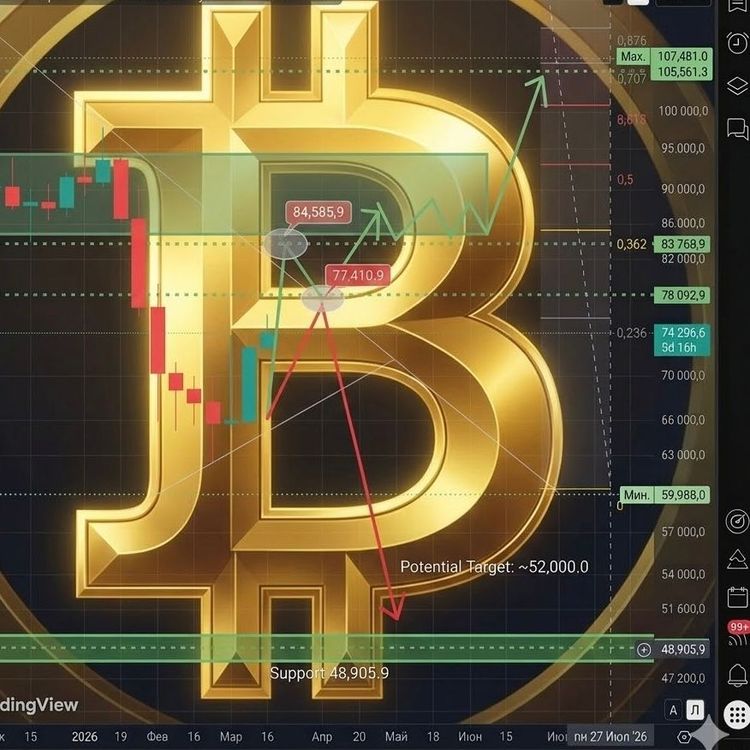
🔴The Bearish Path (Priority Scenario) If Bitcoin fails to hold the $78,000 level, bullish momentum breaks. The market enters a liquidity harvest (stop-loss hunting) targeting $60,000 and potentially $48,000.
📝 TLDR: The Quick Take
- 🏗️ Institutional Floor: ETFs are absorbing $1B+ a week. This is structural demand.
- 🪤 The Trap: A failure to hold $78k triggers a liquidity hunt down to $60k or $48k.
- 🚀 The Target: A weekly close above $84k is the green light for $100k.
- 📊 Verdict: The market is "overheated." Watch for a correction before the next big leg up.
Final Verdict: Spot vs. Derivatives 🎯
Bitcoin is at a crossroads where Real Demand (Spot/ETF) is clashing with Speculative Pressure (Futures/Derivatives). While the short-term trend is undeniably bullish, a mid-term correction may be necessary to gather sufficient liquidity for a sustained move toward $100,000.
Watch the $84,000 level closely. It is the gateway to the next leg of the bull run—or the ceiling for the next trap.
📚 Read Also
- The ERC-1155 Revolution: Bridging Ethereum’s Fragmentation — How token standards are evolving alongside BTC.
- What is Gas? Why Ethereum isn’t free — and why that’s a good thing — Why infrastructure costs matter in a bull market.
- Vitalik’s Sanctuary: The New Ethereum Foundation Manifesto 2026 — The long-term vision for decentralized sovereignty.
Recent News


All Time High • Live
Have questions or want to collaborate? Reach us at: [email protected]