Bitcoin Q1 2026 Analysis: Accumulation Phase or Liquidity Trap?
Bitcoin’s Q1 Hangover: Accumulation Phase or the Ultimate Liquidity Trap? 📉
Bitcoin has officially closed one of its weakest first quarters in nearly a decade. After a parabolic rally to $126,000 in late 2025, BTC finished Q1 2026 down 23.21% — a sharp reality check for a market that had priced in continued upside.
Heading into Q2, the big question remains:
Is this a classic accumulation phase — or a deeper liquidity sweep toward $46,000?
The next 90 days could define the rest of 2026.
Q1 Breakdown: A Perfect Storm of Selling Pressure 🌪
Bitcoin began the year near $88,000, but by March 31, price compressed into the $66,700 – $68,400 range.
Two major forces drove the decline.
Institutional Exit
Data from CoinGlass shows U.S. Spot Bitcoin ETFs recorded $4.5 billion in net outflows during early 2026.
The largest withdrawals came from:
- BlackRock (IBIT)
- Fidelity Investments (FBTC)
This marked the longest institutional selling streak since spot ETFs launched in 2024.
The 2025 institutional hype quickly transitioned into profit-taking and de-risking.
Macro Headwinds Return 🌍
At the same time, macro pressure increased:
- Persistent inflation
- Higher interest rates
- Rising U.S.–Iran geopolitical tensions
Bitcoin moved in lockstep with tech equities, rather than acting as digital gold.
This reinforces a growing trend:
Bitcoin still behaves like a risk asset first.
Q2 Outlook: Accumulation vs. The Flush ⚖️
The market is now split between two dominant narratives.
The Accumulation Case: Smart Money Positioning 🟢
Analyst Sykodelic suggests the market is nearing exhaustion.
According to this view:
- Long-term holders are accumulating
- Bitcoin is trading in a multi-year supply zone
- Selling pressure is weakening
This scenario predicts:
- A brief fake breakdown below $60K
- Followed by a reclaim of $74,400
- Confirmation of a new bullish phase
In short: Pain first, rally after.
The Flush Scenario: Willy Woo’s Warning 🔻
Veteran analyst Willy Woo sees deeper downside risk.
Using the CVDD Floor Model, Woo identifies:
Potential bottom range: $46,000 – $54,000
His concerns include:
- Capital leaving the Bitcoin network since November
- Weakening global liquidity
- Potential Federal Reserve tightening
If macro conditions worsen, Bitcoin could break historical Q2 rebound patterns.
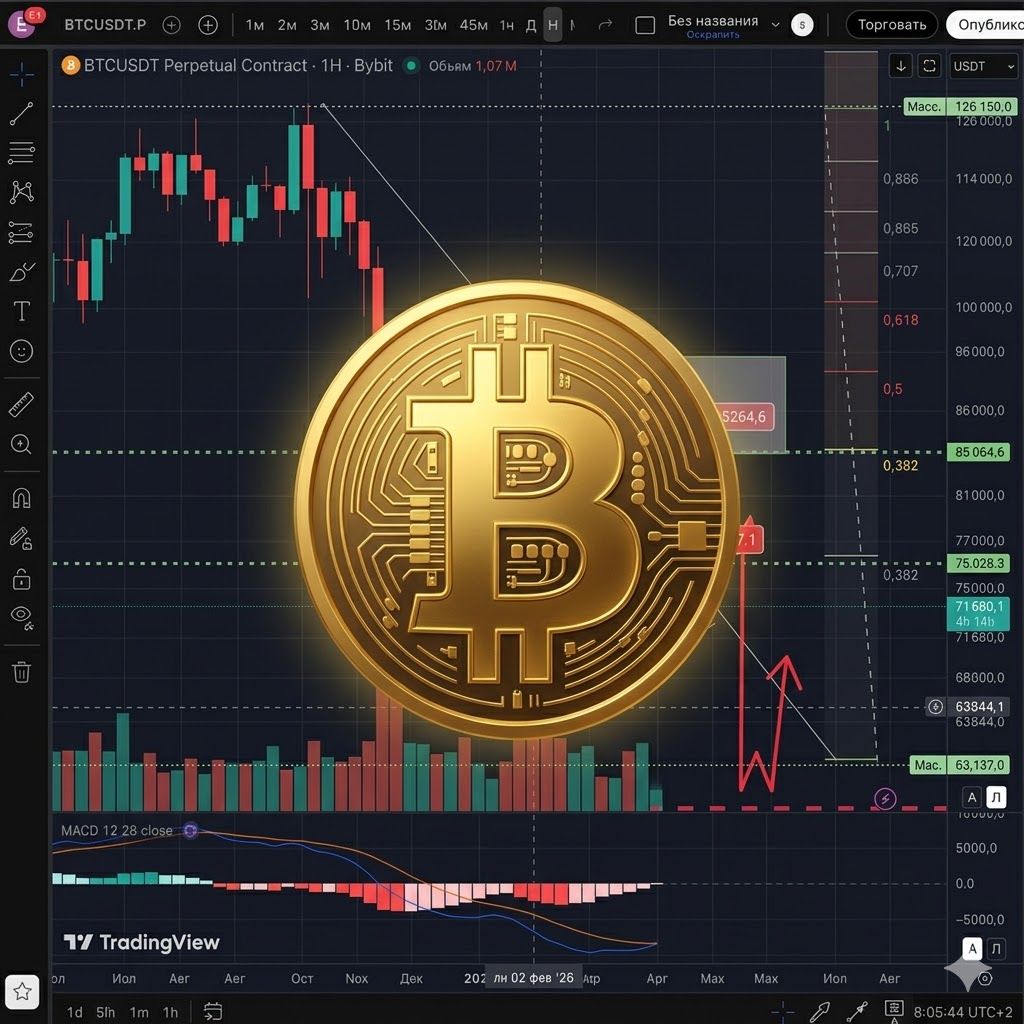
Liquidity Levels to Watch 🎯
Market structure is currently defined by these key zones:
Upside Liquidity
- $74,400 — Bullish reclaim trigger
- $77,000 — Liquidity trap zone
Downside Liquidity
- $60,000 — Weak support
- $54,000 — Major structural floor
- $46,000 — CVDD model floor
These levels define Q2’s battlefield.
The ATH.live Outlook 🧠
Bitcoin appears to be entering a transition phase.
Our base case:
- Short-term bounce toward $77K
- Liquidity trap for late buyers
- Final capitulation toward $54K
- Sustainable bull cycle resumes
This pattern has repeated across previous cycles.
Markets rarely move in straight lines. They move where liquidity is highest.
TLDR 📌
- Bitcoin posted its weakest Q1 in 8 years
- ETF outflows triggered institutional selling
- Analysts split between accumulation vs deeper flush
- Key liquidity trap: $77K
- Major support: $54K
- Nearly 46% of supply is underwater
The bottom may be close.
But historically, Bitcoin tends to deliver one final wick of pain before the next major rally begins. 🚀
📚 Read Also

Recent News


All Time High • Live
Have questions or want to collaborate? Reach us at: [email protected]