Bitcoin $67K Analysis: Liquidity Trap or Q2 Recovery Roadmap?
Bold
Bitcoin Holds $67K After Brutal Q1 — Liquidity Trap or Real Recovery?
Bitcoin is holding above $67,000 after one of the roughest first quarters in recent years.
Since January, BTC has dropped roughly 23%, wiping out leverage, cooling sentiment, and resetting expectations across the market.
But now, the structure is changing.
Volatility is compressing. Selling pressure is slowing. Liquidity is building.
And historically, that combination often precedes a major move.
The question now: Is Bitcoin preparing for recovery — or setting up a liquidity trap?
Market Snapshot 📊
Current positioning:
- 💰 Price: ~$67,400–67,800
- 📉 YTD Performance: ~-23%
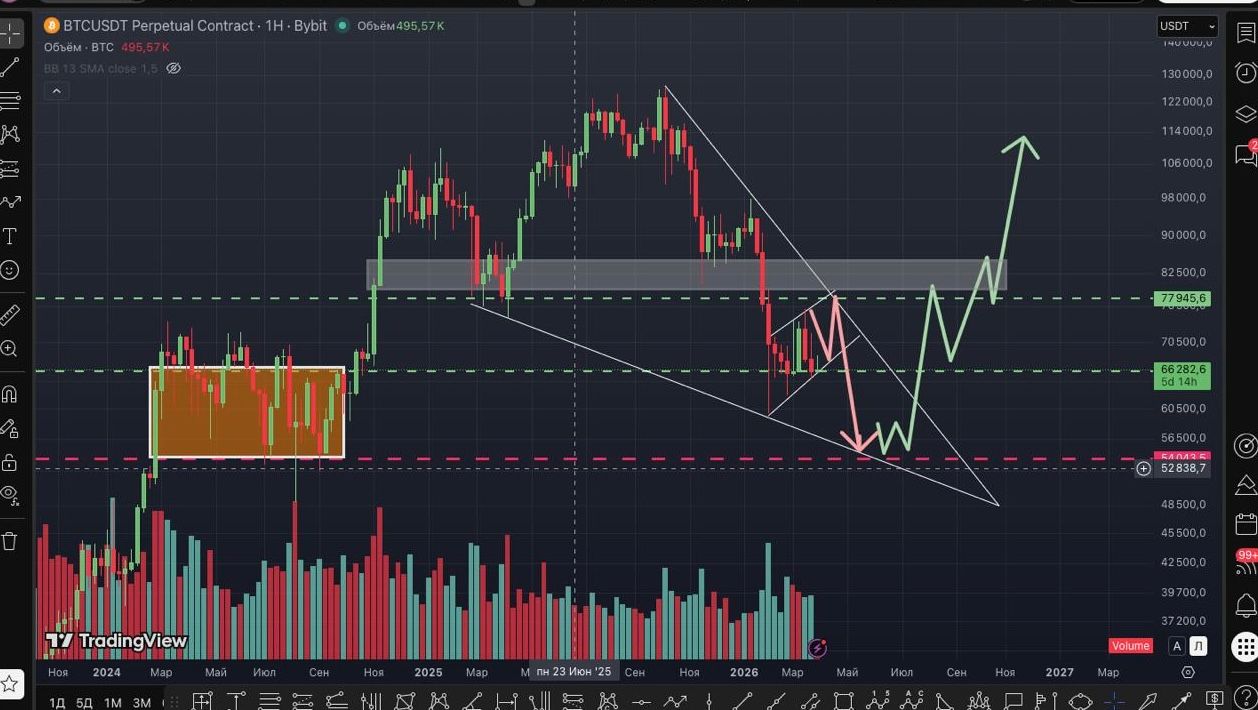
- 🚧 Major Resistance: $77,000
- 🛡 Critical Support: $54,000
- ⚠️ Extreme Wick Zone: $48,000
- 🏦 ETF Inflows: ~$69M daily
- 📊 BTC Supply in Loss: ~45–46%
These levels define the next phase of the market.
One of the Weakest Quarters — But Something Is Changing
Q1 2026 was dominated by:
- risk-off sentiment
- macro uncertainty
- leveraged liquidations
Bitcoin followed traditional risk assets lower, but toward the end of the quarter, the behavior shifted.
Instead of aggressive selling, the market began stabilizing.
Price action narrowed into a range. Volatility declined. Momentum slowed.
This type of compression often appears before large directional moves.
Markets rarely stay quiet for long.
Accumulation or Distribution? The $77K Test
Bitcoin currently appears to be trading inside a potential accumulation range.
However, accumulation doesn't always mean immediate upside.
Often, markets first move toward liquidity.
The next major level sits at $77,000 — a zone likely filled with:
- stop losses
- breakout traders
- short liquidations
A typical liquidity scenario:
Bounce → Test $77K → Rejection → Move Lower
This pattern appears frequently when markets draw liquidity upward before continuing downward.
Short-term bullish sentiment builds. Late buyers enter. Then momentum fades.
Not guaranteed — but structurally common.
Why the $54K Level Still Matters
While Bitcoin stabilizes near $67K, downside risk remains relevant.
The $53K–54K zone is still one of the most important structural levels.
Reasons:
- Previous major support from 2024
- Historical accumulation zone
- Alignment with past cycle structure
Markets rarely respect support levels cleanly.
That opens the possibility of a deeper liquidity sweep.
A wick toward ~$48K remains possible, driven by:
- liquidation cascades
- panic selling
- leverage unwinds
This would mirror behavior seen in previous Bitcoin cycles.
Importantly, such a move wouldn't necessarily break the macro trend.
It would simply reset positioning.
Macro Tailwinds Are Quietly Returning 🌍
Despite weak price performance, macro conditions are improving.
Several signals are turning supportive.
1. Geopolitical Pressure Is Easing
Reports of de-escalation in US–Iran tensions pushed oil prices lower:
$106 → $102
Lower energy prices ease inflation concerns, which can improve liquidity conditions.
Risk assets — including crypto — typically benefit.
2. Institutional Flows Remain Positive
Spot Bitcoin ETFs recorded approximately $69M in daily inflows.
This isn't explosive — but it's important.
Consistent institutional flows often:
- stabilize markets
- reduce volatility
- support accumulation
Even during weak price action, institutions appear to be positioning.
3. Market Psychology Has Reset
Approximately 45–46% of Bitcoin supply is currently underwater.
Historically, this zone appears during:
- late-stage corrections
- accumulation phases
- pre-reversal environments
When nearly half the market sits at a loss, selling pressure often weakens.
Long-term investors begin accumulating.
Smart money typically moves early.
Liquidity First, Direction Later
Bitcoin appears to be entering a transition phase.
Short-term outlook:
- upside liquidity toward $77K possible
- rejection remains likely
- downside test still on the table
Mid-term outlook:
- $53–54K remains key support
- potential wick toward $48K
- macro structure still intact
This looks less like a clean recovery and more like a liquidity-driven setup.
Markets often require one final flush before sustainable trends emerge.
Why This Cycle Feels Familiar
This structure mirrors previous Bitcoin cycles:
- volatility compression
- liquidity sweep higher
- final downside move
- long-term recovery
Bitcoin rarely moves in straight lines.
Instead, it hunts liquidity.
And right now, liquidity exists:
- above $77K
- below $54K
The market may test both.
TLDR 🧠
- 📉 Bitcoin dropped ~23% in Q1 2026
- 📊 Price stabilizing near $67K
- 🚧 Major resistance sits at $77K
- 🛡 Critical support remains at $54K
- ⚠️ Possible liquidity wick toward $48K
- 🏦 ETF inflows remain positive
- 📉 45–46% of BTC supply underwater
Bottom Line: Bitcoin is stabilizing — but the market may still need one final liquidity move before a sustainable recovery begins.
📚 Read Also
Recent News


All Time High • Live
Have questions or want to collaborate? Reach us at: [email protected]