Ethereum Price Analysis 2026: Why ETH Is Struggling to Find a Floor
Ethereum Price Analysis 2026: Why ETH Is Struggling to Find a Floor
Ethereum price is entering a critical phase as key technical levels break down under pressure. What looked like a routine pullback is now evolving into a structural shift — with Fibonacci levels failing and liquidity thinning.
The market is no longer asking “is this a dip?” It’s asking: where is the floor?
📉 The Technical Trigger: Breaking the Backbone
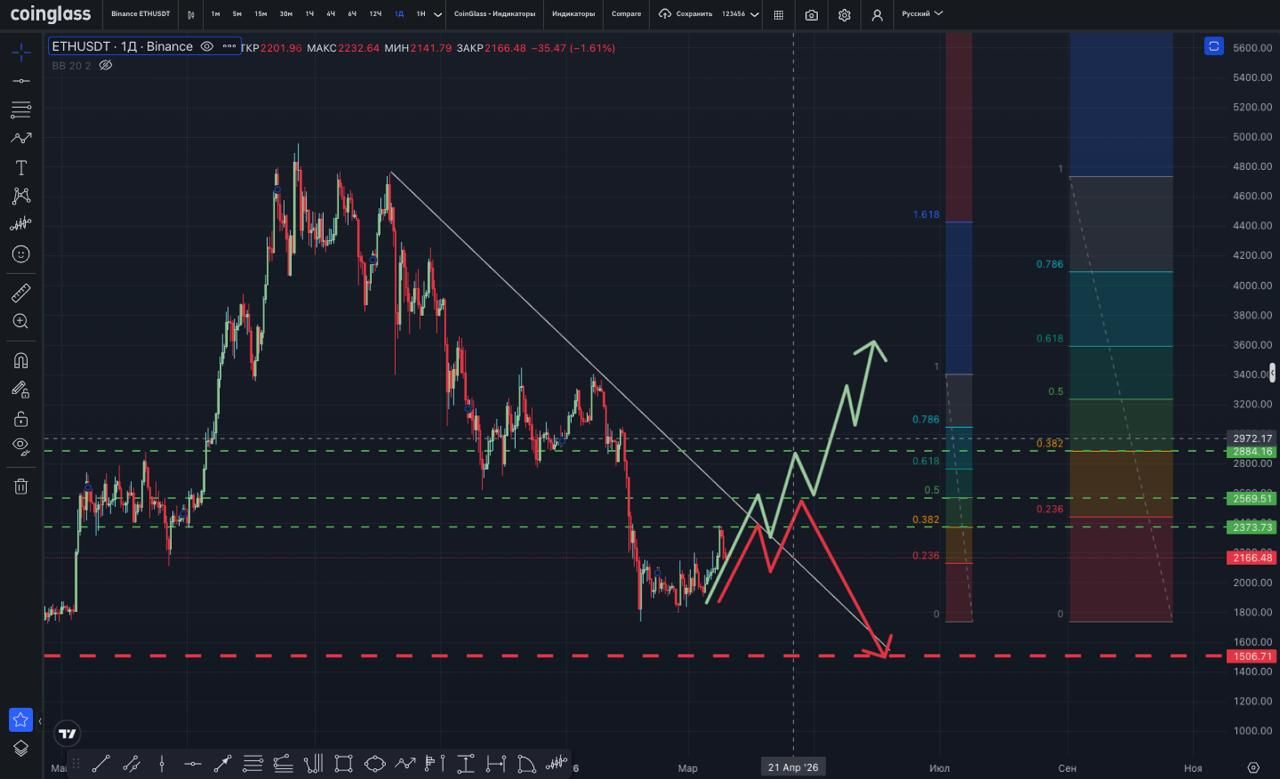
Ethereum’s recent move is defined by a clean breakdown of key Fibonacci levels — a signal that momentum has officially flipped.
What happened:
- Key Breaches: ETH lost the 0.382 level ($2,370) on the daily chart and the 0.236 level on the weekly.
- Volume Confirmation: Trading volume surged +26.7%, confirming real, aggressive selling pressure.
- Structure Flip: The $2,370 zone has turned from a support floor into a resistance ceiling.
This isn’t noise. This is a structure reset.
⛓️ The Bitcoin Contagion: Liquidation Chain Reaction
Ethereum doesn’t move alone. The trigger for this slide came from a massive deleveraging cascade in Bitcoin (BTC):
- $150M+ liquidations in BTC long positions within a 24-hour window.
- Forced deleveraging across derivatives markets.
- Capital rotation out of high-beta assets.
As a higher-beta asset, Ethereum amplified the move. It’s classic crypto mechanics: Bitcoin corrects → leverage unwinds → altcoins overreact.
📊 Ethereum Price Levels: Mapping the Critical Zones
With the technical structure damaged, ETH is now navigating between key “decision zones”:
- 🛡️ Final Defense ($2,158): The 200-day SMA. This is the line that separates a correction from a total breakdown.
- 🧱 Psychological Level ($2,100): A zone with historically high buyer interest.
- 🌊 Global Liquidity ($1,500–$1,600): The deep accumulation range where long-term whales step in.
- 🚫 Primary Resistance ($2,370–$2,400): ETH must reclaim this zone to regain any bullish momentum.
⚠️ Ethereum Price Prediction: Three Scenarios
*� Bearish Scenario (Most Likely) If ETH loses $2,158, the downtrend is confirmed. This opens a direct path toward $2,100, with an extended downside to the $1,500–$1,600 liquidity zone. This is the "full reset" phase.
*� Neutral Scenario If ETH holds $2,158, expect sideways consolidation. The market will range between $2,150 and $2,370 as it attempts to rebuild liquidity.
*� Bullish Scenario If ETH reclaims $2,370, we see a structure recovery. Momentum returns with targets at $2,700 → $2,800 (the 0.5–0.618 Fib levels).
*� TLDR: The Quick Take
- 📉 Fibonacci Breakdown: ETH lost $2,370 on high volume (+26.7%).
- ⛓️ BTC Trigger: $150M+ in liquidations accelerated the drop.
- 🛡️ Critical Level: $2,158 (200-day SMA) decides the trend for Q2 2026.
- ⚠️ Risk: A breakdown here opens the path to a $1,500 reset.
- 📊 Verdict: Ethereum remains fragile until the $2,370 structure is reclaimed.
Final Verdict: The Market Enters Risk-Off Mode 🎯
This isn’t just technical — it’s macro. Ethereum is reacting to tighter liquidity, a massive leverage unwind, and declining risk appetite across global markets.
Until $2,158 is firmly defended, ETH remains in a high-risk zone. Lose it — and the market resets deeper. Hold it — and consolidation begins. Right now, Ethereum isn’t leading the market; it’s reacting to it.
*� Read Also
Recent News


All Time High • Live
Have questions or want to collaborate? Reach us at: [email protected]